

Training on Supply Chain Data Analytics and Visualization
Advanced supply chain data analytics. Master predictive modeling, visualization, and optimization to drive strategic decisions.
Next intake
20 Jul 2026 · Nakuru
Duration
10 days
Live instruction
Delivery
Physical + Virtual
Cohort based
Level
Advanced
Working professionals
Certification
NITA reimbursable
For Kenyan cohorts
Language
English
All materials
About this programme
This advanced course empowers logistics professionals to harness the power of data. Participants will move beyond basic reporting to perform sophisticated analyses using statistical methods, predictive modeling, and data visualization tools. The focus is on translating complex supply chain data into actionable insights that drive strategic decision-making and operational excellence.
Who Should Attend:
-
Supply Chain Analysts
-
Logistics Managers
-
Data Scientists in Supply Chain
-
Operations Research Professionals
What you'll walk away with
-
Perform advanced data extraction, cleaning, and transformation on supply chain datasets.
-
Apply statistical and predictive models for demand forecasting and logistics optimization.
-
Create impactful visualizations and dashboards to communicate complex findings.
-
Use data analytics to identify root causes of supply chain inefficiencies.
What we cover, module by module
Module 1: The Data-Driven Supply Chain
-
Moving from descriptive to predictive and prescriptive analytics.
-
Identifying key data sources: ERP, TMS, WMS, IoT, and external data.
-
Data governance, quality, and integrity principles.
-
Case Study/Hands-on Exercise: Assess the data quality of a sample supply chain dataset (e.g., order history) by identifying missing values, outliers, and inconsistencies, and propose a data cleansing plan.
Module 2: Exploratory Data Analysis (EDA) and Visualization Fundamentals
-
Principles of effective data visualization (e.g., using Gestalt principles).
-
Creating univariate and bivariate visualizations to uncover patterns.
-
Identifying correlations and distributions in supply chain data.
-
Case Study/Hands-on Exercise: Perform EDA on a freight spend dataset to visualize spend distribution by mode, carrier, and lane, and identify initial hypotheses for cost savings.
Module 3: Advanced Demand Forecasting Techniques
-
Time series analysis: decomposition, autocorrelation, and stationarity.
-
Advanced models: ARIMA, Exponential Smoothing, and Prophet.
-
Incorporating causal factors (e.g., promotions, economic indicators) into forecasts.
-
Case Study/Hands-on Exercise: Build and compare a simple moving average model with an ARIMA model to forecast demand for a volatile SKU, evaluating forecast accuracy using MAPE.
Module 4: Inventory Optimization and Safety Stock Modeling
-
Statistical methods for determining safety stock levels based on service level and lead time variability.
-
Using ABC-XYZ analysis for inventory segmentation and policy setting.
-
Simulation of inventory policies under demand uncertainty.
-
Case Study/Hands-on Exercise: Calculate the optimal safety stock and reorder point for a portfolio of SKUs with varying demand and lead time variability to achieve a target service level.
Module 5: Network Optimization Modeling
-
Fundamentals of facility location and network design models.
-
Using optimization tools (e.g., Solver, Python optimization libraries) to minimize cost while meeting service constraints.
-
Scenario analysis for network changes (e.g., adding a new DC).
-
Case Study/Hands-on Exercise: Formulate and solve a facility location model to determine the optimal number and location of distribution centers to minimize total transportation and warehousing cost for a given demand pattern.
Module 6: Transportation Analytics and Mode Optimization
-
Analyzing freight data to identify optimal mode and carrier mix.
-
Creating cost-to-serve models at the customer and product level.
-
Using regression analysis to understand drivers of freight cost.
-
Case Study/Hands-on Exercise: Build a regression model to predict LTL freight cost based on weight, distance, and freight class, and use it to identify shipments that are overpaying compared to the model.
Module 7: Machine Learning for Supply Chain
-
Introduction to supervised (classification, regression) and unsupervised (clustering) learning.
-
Using clustering for customer segmentation and inventory categorization.
-
Using classification for predicting late deliveries or supplier risk.
-
Case Study/Hands-on Exercise: Build a classification model (e.g., logistic regression or decision tree) to predict which shipments are likely to be late based on carrier, lane, day of week, and weather data.
Module 8: Data Visualization and Dashboarding with Tableau/Power BI
-
Advanced dashboard design principles for executive and operational users.
-
Creating interactive dashboards for KPIs, root cause analysis, and scenario exploration.
-
Telling a compelling story with data to influence stakeholders.
-
Case Study/Hands-on Exercise: Design an interactive supply chain control tower dashboard in Tableau or Power BI that provides real-time visibility into orders, inventory, and shipments, with drill-down capabilities for root cause analysis.
Module 9: Data Storytelling and Communication
-
Structuring a data-driven narrative for different audiences (executives vs. operators).
-
Avoiding common pitfalls in data presentation.
-
Building a business case using data and visualizations.
-
Case Study/Hands-on Exercise: Develop a 5-slide presentation for senior leadership that uses data visualizations to present findings on a significant freight spend increase and recommend a specific mitigation strategy.
Module 10: Advanced Analytics Implementation and Culture
-
Building a Center of Excellence (CoE) for supply chain analytics.
-
Managing the lifecycle of an analytics project.
-
Fostering a data-driven culture within logistics teams.
-
Case Study/Hands-on Exercise: Create a project charter for implementing a predictive maintenance analytics solution for a fleet, including scope, stakeholders, data requirements, and expected ROI.
Where the change lands
Organizational Impacts:
-
Improved forecast accuracy and inventory optimization.
-
Data-driven identification of cost savings and process improvements.
-
Enhanced agility to respond to market changes and disruptions.
Individual Impacts:
-
Mastery of data manipulation, statistical analysis, and visualization techniques.
-
Proficiency in using tools like Python, R, or advanced Excel/Tableau for supply chain analytics.
-
Strategic ability to communicate data-driven insights to leadership.
Dates and locations
Upcoming intakes
Every intake is limited to a small cohort. Booking closes when a date fills or three weeks before the start, whichever comes first.
| City | Starts | Ends | Delivery | Book |
|---|---|---|---|---|
NakuruNext | 20 Jul 2026 | 31 Jul 2026 | In-Person | Book |
Kigali | 20 Jul 2026 | 31 Jul 2026 | In-Person | Book |
Accra | 20 Jul 2026 | 31 Jul 2026 | In-Person | Book |
Kisumu | 27 Jul 2026 | 07 Aug 2026 | In-Person | Book |
Johannesburg | 27 Jul 2026 | 07 Aug 2026 | In-Person | Book |
Dakar | 27 Jul 2026 | 07 Aug 2026 | In-Person | Book |
- NakuruNext
20 Jul → 31 Jul·In-Person
Book this intake - Kigali
20 Jul → 31 Jul·In-Person
Book this intake - Accra
20 Jul → 31 Jul·In-Person
Book this intake - Kisumu
27 Jul → 07 Aug·In-Person
Book this intake - Johannesburg
27 Jul → 07 Aug·In-Person
Book this intake - Dakar
27 Jul → 07 Aug·In-Person
Book this intake
Common questions.
Still not sure? Send us a note and a facilitator will get back to you within a business day.
You may also like.
Programmes in the same discipline that participants often pair with this course.
 Hybrid10 days
Elevate your distribution center. Learn to integrate WMS with robotics and AI for scalable, high-efficiency logistics.
 Hybrid5 days
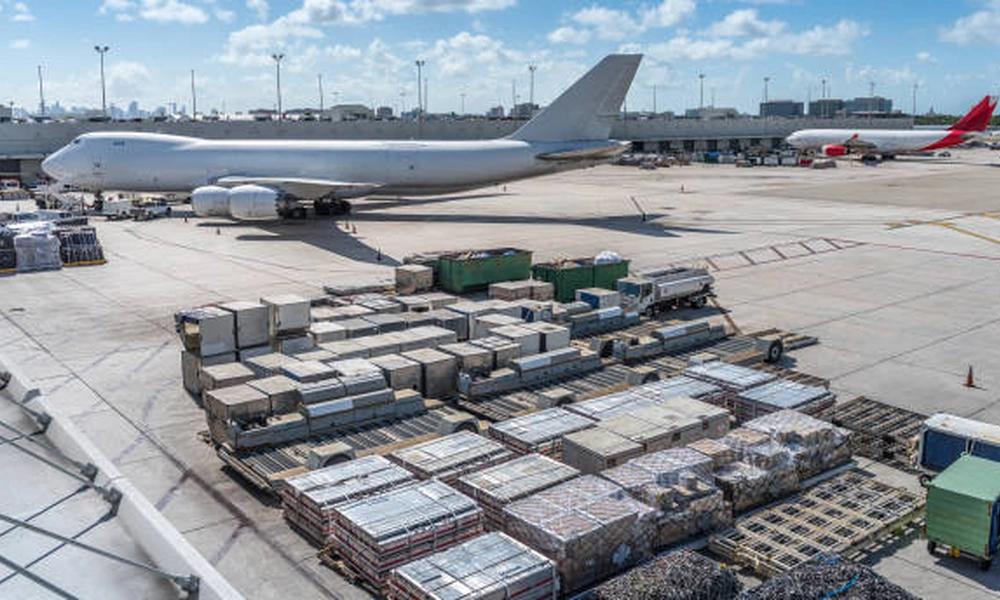
Master air cargo logistics and freight forwarding. Learn IATA regulations, documentation, and consolidation strategies. Intermediate.
 Hybrid5 days
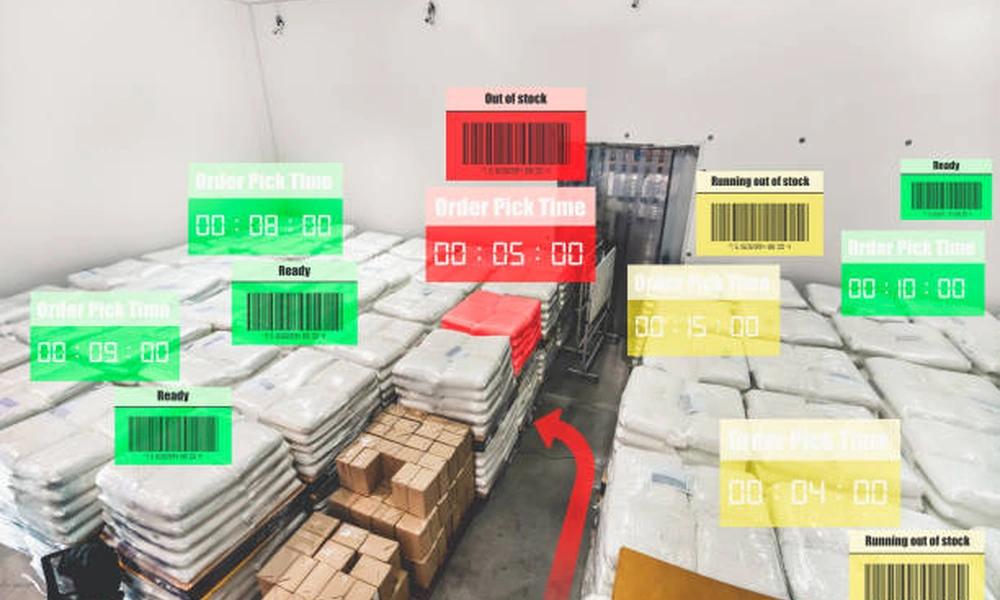
Master cold chain logistics. Learn temperature-controlled packaging, GDP compliance, and risk management for sensitive products.
Course finder
Find the right course for you
Prefer to talk it through? Send us an enquiry and a facilitator will scope a fit within a business day.
For corporate teams
Training 10+ professionals?
We deliver Training on Supply Chain Data Analytics and Visualization in-house at your offices, at a venue we arrange, or fully virtual. Customise the curriculum against your KPIs, and get a bespoke price for the cohort size you need.